News and Blog
The Joint Institute for Strategic Energy Analysis (JISEA) increases the impact of its analysis by staying engaged in and helping to shape the global energy dialogue. News and blogs about JISEA, JISEA leadership, JISEA partners, and JISEA programs are highlighted below.
Want more? Sign up for our email news or follow us on Twitter.
From Mines to Manufacturer: Tracing the Li-Ion Battery Supply Chain
September 19, 2019—Most people probably don't stop to think about the source of the various components of their vehicles. The raw materials used to manufacture key components of lithium-ion batteries—including cobalt and lithium—travel a long path from the mines to the manufacturer to the car in your garage.

While high-level supply chain analysis is commonplace, few studies trace the chain all the way back to the raw materials, due to difficulty in disaggregating the trade and market data necessary to gauge technology-specific supply and demand. And the challenge is even greater when talking about a specific clean energy technology, such as light-duty vehicles (LDV), due to its small market share.
In their new report, researchers Tsisilile Igogo, Debra Sandor, Ahmad Mayyas, and Jill Engel-Cox develop a foundation to incorporate raw materials into the Clean Energy Manufacturing Analysis Center (CEMAC) Benchmark framework. The CEMAC/NREL researchers explore the supply chains of cobalt and lithium to better understand the raw materials markets' link in clean energy technology supply chains and their impact on LDV development.
Cobalt as a by-product
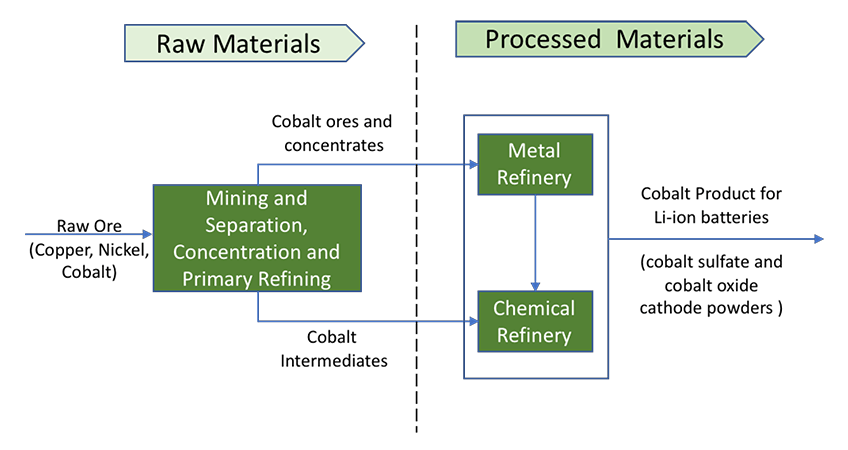
When researchers took a look at the cobalt supply chain between 2014 and 2016, they found that 67% of cobalt mined was a byproduct of copper, 32% a byproduct of nickel, and only 1% came from primary cobalt mines. After mining, the raw ore undergoes a process of concentration and refining, frequently in a different location or country from where it was mined (see Figure 1).

Figure 1. Cobalt supply chain in LIB manufacturing
Most cobalt deposits are found in the Democratic Republic of Congo (DRC), the Central African Republic, and Zambia. According to the U.S. Geological Survey (USGS), in 2016, global cobalt reserves amounted to approximately 7 million metric tons, of which 47% was located in the DRC. From 2014-2016, 53% of global mined cobalt ore came from the DRC, and China accounted for 47% of global refined cobalt production during those same years. China's close involvement in the supply chain stems from its outsized role in the lithium-ion battery (LIB) manufacturing for consumer electronics and LDVs.
In 2016, 40% of total global cobalt production was driven by LIB cell production (all uses); 5% of global production was for LDV batteries. The demand for LIB for electric cars increased by more than 190% between 2014 and 2016. During that same time period, the proportion of global cobalt consumption related to electric vehicles increased from 1.4% to 5% of total mine production. China was the lead consumer of cobalt, followed by Belgium, Japan, and South Korea. Researchers suggested that China's growing demand for LDVs could be driving Chinese cobalt demand.
The DRC is the leading exporter of cobalt, and China is the lead importer. In 2016, most countries decreased exports and imports of cobalt, due to the emerging market economic slowdown and the decline in metal prices during this time.
Growing LDV demand, growing lithium demand
The lithium supply chain is less complex than that of cobalt. Lithium is extracted from either brine or hard rock, called spodumene. Recovering lithium from brine requires drilling, pumping liquids, and evaporation ponds. Hard rock recovery involves extracting lithium from the ore.
As of 2016, spodumene reserves were primarily located in Australia; lithium brine reserves in Chile, Argentina, and China. The total global lithium reserves were estimated to be at 16 million metric tons in 2016, and between 2014 and 2016, lithium production grew. Though nickel and copper prices crashed during this timeframe, lithium prices soared. The growing LDV Li-ion battery manufacturing was a partial driver of these high prices. Between 2014 and 2016, Australia led in raw lithium production and China led in lithium carbonate production.
Lithium demand is driven by battery production, in addition to ceramics and glass. In 2016, 34% of the global lithium production was used in LIB cells; 12% for LDV batteries. Lithium for LDV consumption grew 46% from 2014 through 2015; and another 28% from 2015 through 2016. China was, by far, the largest consumer of lithium for LDVs, and its global consumption grew substantially during the 2014 to 2016 time period, mirroring growing global LDV demand.
As far as the lithium trade flow goes, Australia is the leading producer of lithium, but exports most of its unprocessed lithium ore to China. Chile is the leading exporter of tracked lithium materials, exporting $1.1 billion between 2014 and 2016 to mainly South Korea, Japan, and China.
Bringing raw materials into the fold
Benchmarking raw materials used in the clean energy technology supply chains can serve multiple aims: It can help countries to see the value in the manufacture of clean energy technologies, it can help to pinpoint resource ownership, and to identify supply chain risks and opportunities.
Ultimately, the researchers found the cobalt supply chain to be relatively less secure than the lithium supply chain. Cobalt suffered price volatility of the copper and nickel markets on top of the effects of the economic slowdown.
The analysis also painted a picture of various countries' efforts to secure the future availability of raw materials, such as mine and refinery ownership, as is the case with China for cobalt and lithium, respectively.
Disaggregation of such trade and market data is no easy task, however its role in clean energy technology supply risk reduction is priceless.
For more information, see the full report.
Back to JISEA News >

